PS-InSAR vs
leveling surveys
The first question engineers ask about satellite displacement data: how does it compare against leveling? It has a measured answer. Validation studies that run both methods over the same ground report agreement at the millimeter level — with real differences in what each method measures. Here are the numbers and the differences.
What validation studies report
Multiple published studies compare PS-InSAR displacement measurements against co-located leveling benchmarks. The typical findings: mean absolute differences of roughly 2–4 mm on displacement, and velocity agreement within a few millimeters per year, with the best-conditioned scenes closer to 1–2 mm/yr. A widely cited validation of Sentinel-1 PSI and SBAS velocities against GNSS and geodetic leveling is open access at MDPI Remote Sensing.
The honest caveats: agreement degrades where radar coherence is poor, results vary by scene and processing chain, and a comparison requires projecting the satellite's line-of-sight measurement into the vertical. No single number covers every site — which is exactly why a per-site feasibility check comes before any reliance on the data.
They measure different things
| Optical leveling | PS-InSAR | |
|---|---|---|
| Direction | True vertical, absolute datum | Satellite line of sight, relative to a reference |
| Points | The benchmarks you install | Thousands of natural reflectors per km² in built areas |
| Cadence | Per campaign — monthly to yearly | Every 6–12 days, automatically |
| History | Starts when you start | Archive reaches back to 2015, before you asked |
| Site access | Required, every campaign | None |
| Where it fails | Coverage and cost at area scale | Vegetation, water, and low-coherence ground |
When to use which
Use leveling where the job needs an absolute datum, certified precision at specific structures, or sign-off that satellites cannot carry. Use the satellite record where the job needs history that predates the project, coverage beyond a handful of benchmarks, or a cadence no crew can sustain.
In practice the methods compose. The satellite history tells you where the ground moves before you design the leveling campaign — so the benchmarks land where the motion is, not on a regular grid. During works, the two cross-check each other. After works, the satellite record keeps running when the campaigns stop. Screening first, instrumentation where it counts: that order is cheaper and it reads better in front of a client.
For the broader comparison against total stations and GNSS, see satellite radar vs traditional survey. For how our own processing works, metric by metric, see the methodology.
The deliverable
The report your client sees
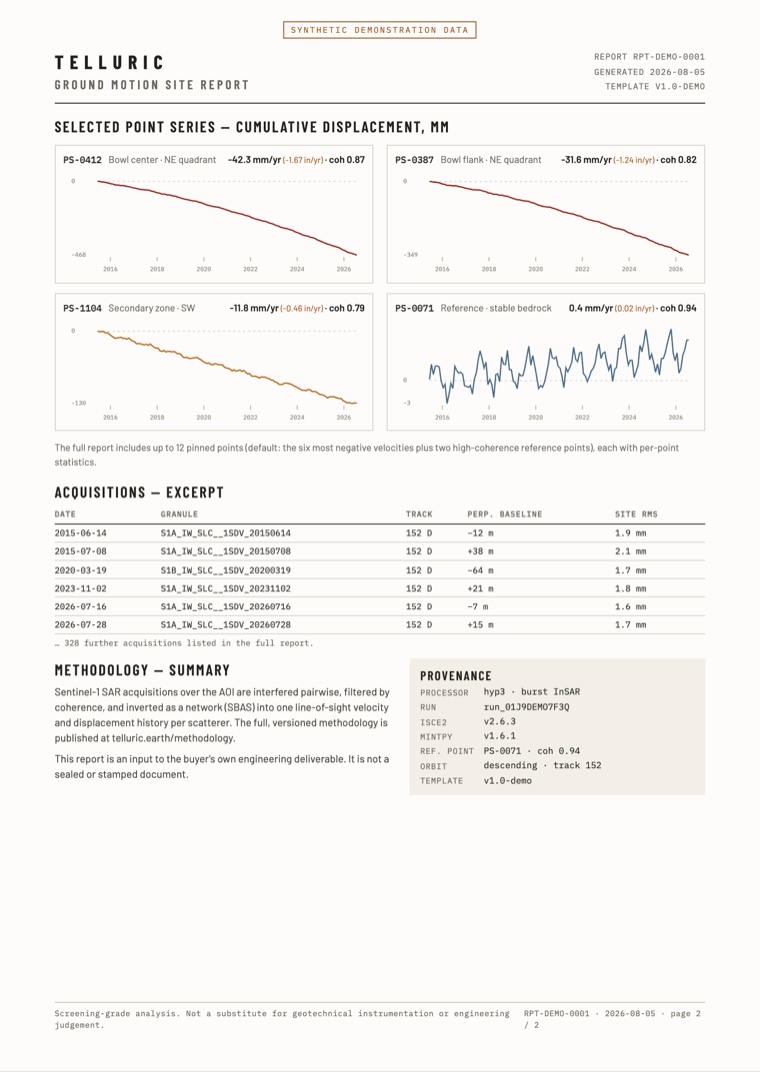
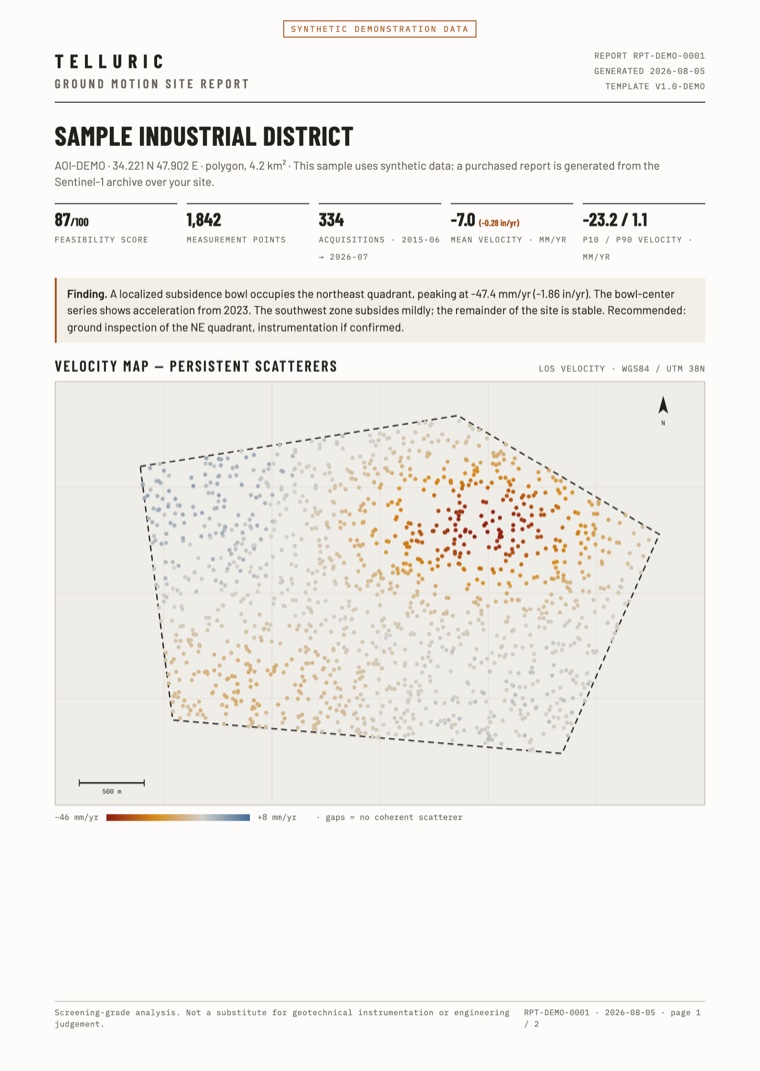
The velocity map, the movement history of each selected point, the list of satellite passes, and the processing record. Use it as an input to your own stamped deliverable.
PDF · two pages · synthetic demonstration data
See ten years over your site
Draw your site, and you get a free feasibility report from the Sentinel-1 radar archive in about one minute. It tells you how many passes cover the site, how often, over what period — and if the satellites can measure it at all. If they cannot, the report says so.
Check your site freeTelluric readings come from satellite radar and are screening-grade: use them to decide where to inspect. They do not replace geotechnical instrumentation or engineering judgment. Read the methodology.