Is there an EGMS
for the US?
European engineers get free, processed ground-motion data for the whole continent from the European Ground Motion Service. US engineers ask a reasonable question: where is ours? The short answer: there is no single US equivalent, but the pieces exist. Here is what each piece covers, and how to close the gap for a specific site.
What EGMS is, and why it matters here
The European Ground Motion Service processes the Sentinel-1 radar archive into millimeter-scale displacement data for every EU-covered territory, updates it on a fixed cycle, and gives it away. Since it launched, ground-motion data has stopped being exotic in European practice. Desk studies cite it. Regulators expect it. That expectation crosses the Atlantic faster than the data does.
EGMS coverage stops at Europe's border. It holds nothing for any US site.
What the US has instead
| Source | Coverage | What it gives you — and what it does not |
|---|---|---|
| ASF Displacement Portal (NASA) | North America, mid-2016 → | Free browser over the OPERA DISP-S1 product: velocity map and per-point time series, updated weekly. No reliability verdict, no report, no alerts, and documented display limits — see our reading guide |
| USGS studies | Known problem regions | Deep, credible analyses of documented cases — Houston–Galveston, the Central Valley. Nothing on demand for an arbitrary site |
| State programs | Patchy | California publishes basin-scale subsidence data through DWR for groundwater management. Most states publish nothing |
| Commissioned study | Any site | Custom processing plus expert interpretation, typically $10,000–30,000 and several weeks per site |
The pattern: the US has excellent data and no service. Every option is either a browser without answers, a study of somewhere else, or consulting priced for safety-critical assets.
Closing the gap for one site
This is the job Telluric does. Draw a site anywhere — in the US or outside it — and the free feasibility check tells you what the satellite archive holds over it and whether the measurement is reliable there. If it passes, a report gives you the full movement history back through the archive: per-cell rates, time series, and a dated PDF that goes into your deliverable. Monitoring watches every new pass after that.
The comparison is honest: EGMS is a continental map, and we are a per-site answer. If a free map answers your question, use the free map. The gap we close is the one an engineer actually has at bid stage — this site, a defensible record, this week.
The deliverable
The report your client sees
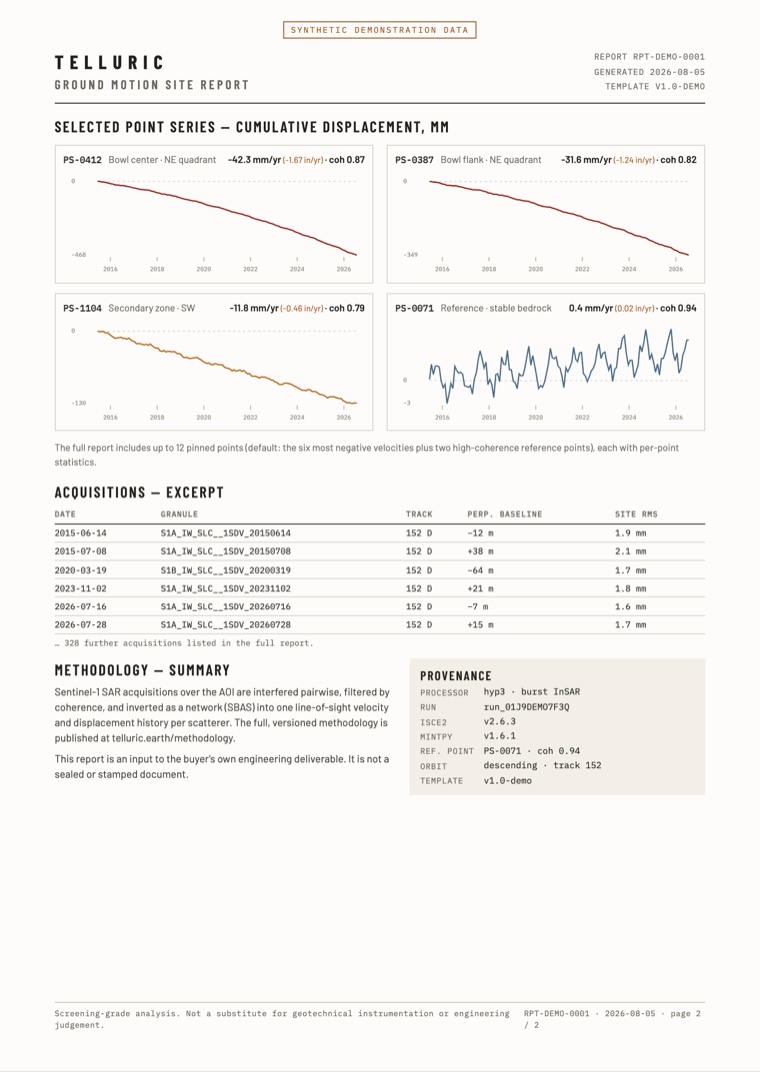
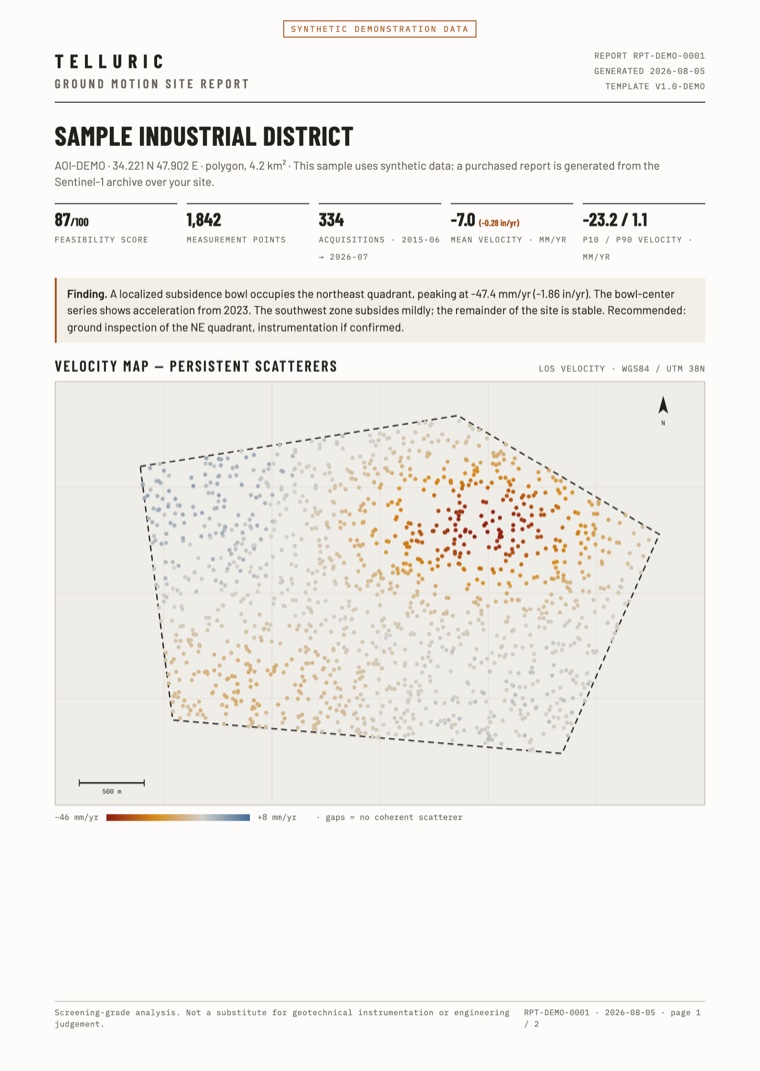
The velocity map, the movement history of each selected point, the list of satellite passes, and the processing record. Use it as an input to your own stamped deliverable.
PDF · two pages · synthetic demonstration data
Check any US site
Draw your site, and you get a free feasibility report from the Sentinel-1 radar archive in about one minute. It tells you how many passes cover the site, how often, over what period — and if the satellites can measure it at all. If they cannot, the report says so.
Check your site freeTelluric readings come from satellite radar and are screening-grade: use them to decide where to inspect. They do not replace geotechnical instrumentation or engineering judgment. Read the methodology.