How to read the
ASF Displacement Portal
NASA publishes free ground-movement data for North America, and the ASF Displacement Portal puts it in your browser: a velocity map, and a time series for every point. It is a good tool. It also has documented limits that matter if you plan to rely on it. This guide covers both.
What the portal shows
The portal displays OPERA DISP-S1: a NASA/JPL displacement product computed from the Sentinel-1 radar archive. Coverage is North America. The record reaches back to mid-2016 on a 30 m grid, and new measurements arrive weekly. The map colors show average velocity. Click a point and you get its displacement time series.
Two reading notes first. The velocities are in meters per year, so a reading of -0.005 m/yr means 5 mm of motion per year. And the motion is measured along the satellite's line of sight — toward or away from the satellite — not straight down. Subsidence appears as motion away from the satellite (negative values).
Four limits to check before you rely on it
These come from ASF's own documentation, not from us. They are display choices, not errors — but each one changes what a reading means.
- — Wide signals are filtered out. The display removes signals broader than 30 km. A regional subsidence bowl — the Houston–Galveston kind — disappears by design. A site inside one can read as stable.
- — The reference floats. Measurements are relative to a local reference that is not fixed. ASF documents the artifact this produces: apparent uplift inside an area that is actually subsiding.
- — No atmospheric correction in the display. Water vapor adds noise to individual epochs. A single odd reading is weather until proven otherwise.
- — The display is not the data. The full product — with correction layers and no display filter — is NetCDF files behind an Earthdata login. Reading them is real work.
What the portal does not do
The portal is a data browser, and a good one. It is not a verdict. It does not tell you whether the measurement over your site is reliable, or why holes appear where coherence fails. It produces no report you can date, brand, and put in front of a client. It does not watch your site or send an alert when the trend changes. And its coverage ends at North America.
Our position is simple: the data is free and good, and we build on the same public archives. What we sell is the layer the portal deliberately leaves out — a feasibility verdict for your specific site, our own reference handling and corrections, a dated evidence-grade PDF, and monitoring that emails you when the movement changes. If the browser answers your question, use the browser. When you need the answer layer, that is us.
Related: how the portal fits the wider picture of US ground-motion data — is there an EGMS for the US? — and how satellite measurements compare against ground survey in PS-InSAR vs leveling.
The deliverable
The report your client sees
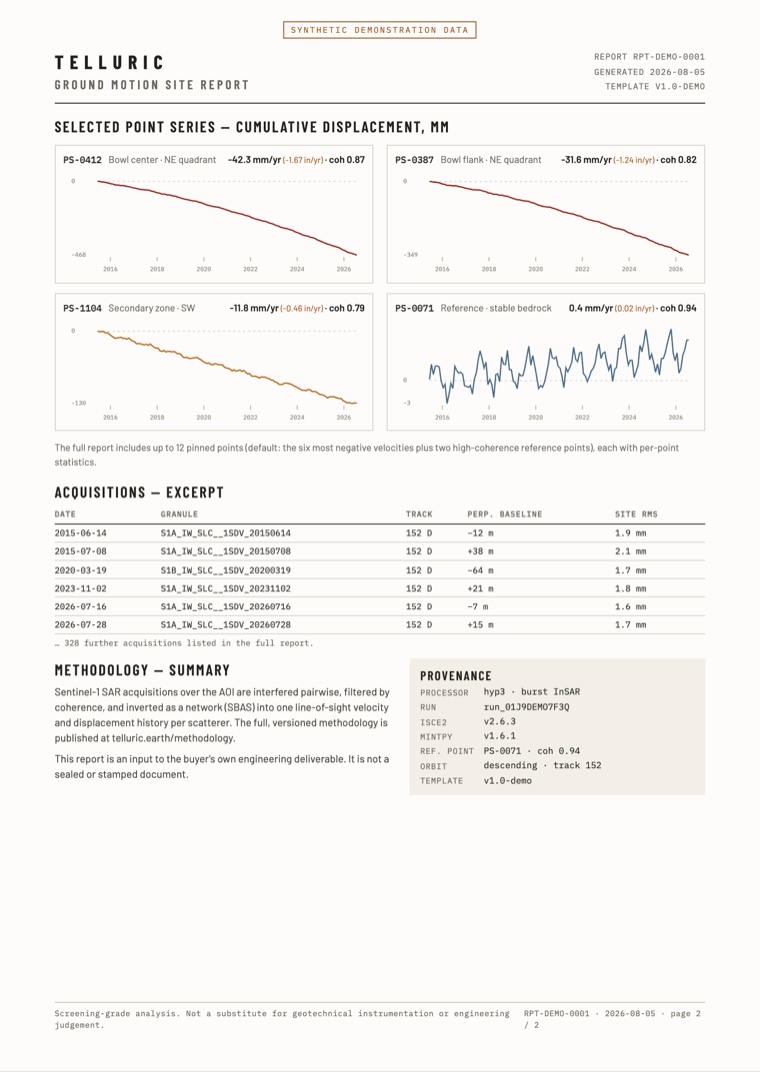
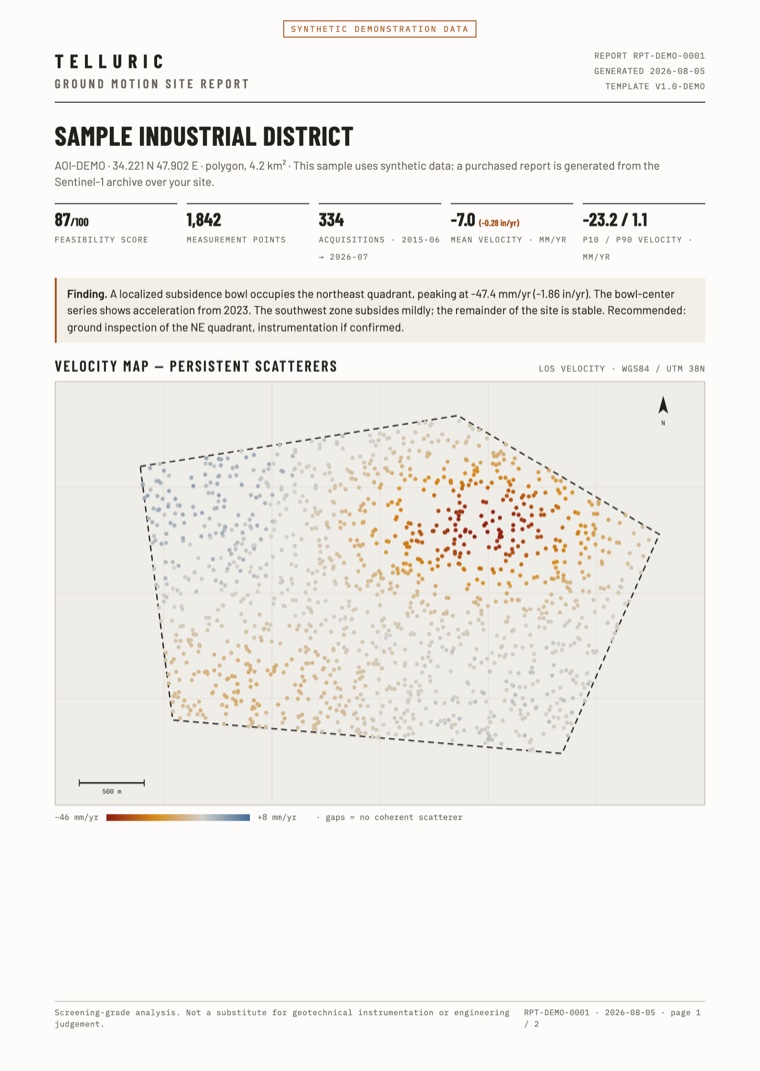
The velocity map, the movement history of each selected point, the list of satellite passes, and the processing record. Use it as an input to your own stamped deliverable.
PDF · two pages · synthetic demonstration data
Get the answer layer for your site
Draw your site, and you get a free feasibility report from the Sentinel-1 radar archive in about one minute. It tells you how many passes cover the site, how often, over what period — and if the satellites can measure it at all. If they cannot, the report says so.
Check your site freeTelluric readings come from satellite radar and are screening-grade: use them to decide where to inspect. They do not replace geotechnical instrumentation or engineering judgment. Read the methodology.